#%config InlineBackend.figure_format='svg'
from numpy import zeros,pi,inf,linspace,arange,abs,dot,exp
from scipy.linalg import toeplitz,norm
from matplotlib.pyplot import figure,subplot,semilogy,loglog,title,xlabel,ylabel,axis,grid
from chebPy import *
Nmax = 50
E = zeros((4,Nmax))
for N in range(1,Nmax+1):
D,x = cheb(N)
v = abs(x)**3 # 3rd deriv in BV
vprime = 3.0*x*abs(x)
E[0][N-1] = norm(dot(D,v)-vprime,inf)
v = exp(-(x+1.0e-15)**(-2)) # C-infinity
vprime = 2.0*v/(x+1.0e-15)**3
E[1][N-1] = norm(dot(D,v)-vprime,inf)
v = 1.0/(1.0+x**2) # analytic in a [-1,1]
vprime = -2.0*x*v**2
E[2][N-1] = norm(dot(D,v)-vprime,inf)
v = x**10
vprime = 10.0*x**9 # polynomial
E[3][N-1] = norm(dot(D,v)-vprime,inf)
titles = ["$|x|^3$", "$\\exp(-x^{-2})$", \
"$1/(1+x^2)$", "$x^{10}$"]
figure(figsize=(10,10))
for iplot in range(4):
subplot(4,2,2*iplot+1)
semilogy(arange(1,Nmax+1,),E[iplot][:],'.-')
title(titles[iplot]+", semilogy")
xlabel('N'), ylabel('error'), grid(True)
subplot(4,2,2*iplot+2)
loglog(arange(1,Nmax+1,),E[iplot][:],'.-')
title(titles[iplot]+", loglog")
xlabel('N'), ylabel('error'), grid(True)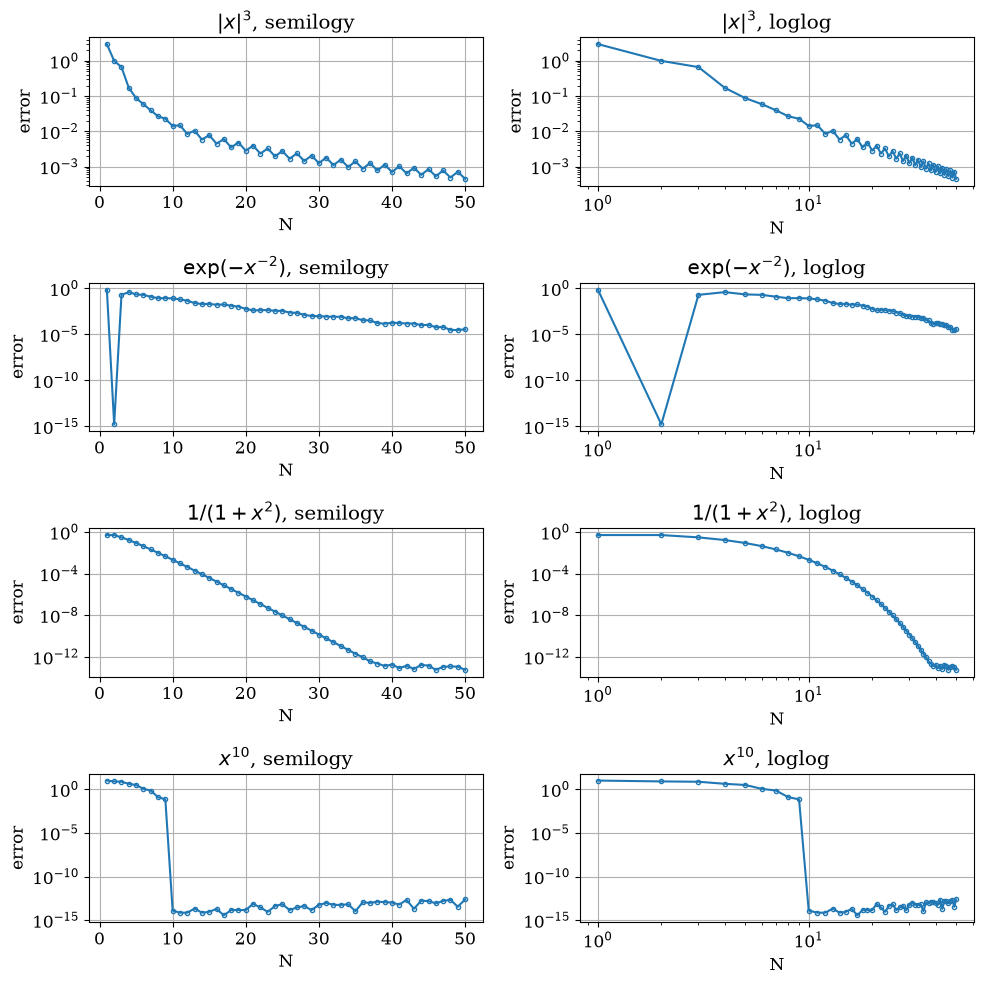
: loglog plot is straight line indicating algebraic decay of the form .
: loglog plot goes down faster than a straight line, indicating faster than algebraic decay.
: semilogy plot is straight line, indicating exponential decay of the form .
: for we get exact answer.